Keep calm and stay invested: Mark Rider’s essential advice to beat market turbulence

18 September 2024
In a career spanning five decades in the finance industry, Mark Rider has seen his share of market ups and downs. Here is his take on how to safeguard your finances when markets are volatile.
After navigating every major financial crisis since the 1987 stock market crash, Brighter Super’s Chief Investment Officer Mark Rider has some sage advice for superannuation members nervous about recent market turbulence.
Keep calm and stay the course.
‘The risk is, if you change your investment option and go more conservative due to falling markets, you may end up getting stuck there and miss out on the eventual market recovery,’ Mr Rider says.
At times of global market turbulence, such as those experienced in early August, superannuation investors are often tempted to switch their investment options to cash.
For example, in March 2020, during the market crash caused by COVID-19, nearly 10% of Brighter Super members with a pension switched significant allocations of their investments to cash.
Seventy percent of those members switched in late March at the bottom of the pandemic share market crash, missing the subsequent rebound in share markets.
Mr Rider says experience shows that staying invested is the best long-term strategy.
Over time, short-term losses are recovered and turned into solid gains.
For example, for the year ended 30 June 2024 Brighter Super’s Growth option achieved 9.75% p.a. returns over the past seven years, while its Balanced option achieved 8.50% p.a. over the same period.1
Mr Rider says economies have a fundamental bias towards growth and governments step in when the system is confronting a major crisis.
‘Economies grow over the medium term, company profits rise and employment and wages follow this trend,’ Mr Rider says. ‘Markets over time will reflect what the economy is doing.’
‘It’s best to stay invested. We build our options to navigate the inevitable ups and downs in markets. If you react and get out at the bottom, you may be stuck there,’ Mr Rider says.
Riding the Black Monday rollercoaster
The first financial crisis of Mr Rider’s career came in 1987, not long after he had joined the Reserve Bank of Australia, where he stayed 10-years and ultimately ended up as the Head of Economic Activity and Forecasting.
Dubbed Black Monday, the New York Stock Exchange’s Dow Jones Industrial Average fell 22.6% on 19 October 19872. The following day the Australian market fell 25% and had declined by 42% by the end of October.3
‘The concern was that there was such a destruction of wealth, and a hit to confidence, that it would impact on the economy,’ Mr Rider says.
He said the US Federal Reserve Bank had been raising interest rates prior to the crash but ultimately eased rates because of fears of the impact of the stock market crash on the economy and to provide significant liquidity to markets in the wake of the financial market upheaval. The economy continued to recover, with the share market surpassing the previous peak within tqo years after the sudden crash.
In Australia, interest rates had been falling in the year leading up to the stock market crash and this easing of monetary policy coincided with financial deregulation in Australia.
With new foreign banks entering the market and providing a wave of credit, the much-feared downturn morphed into a booming economy. With the ensuing deep recession in the early 1990s – the so called ‘Recession we had to have’ – Australia took until 1993 to move above the pre-crash peak.
‘However, from the low point in the market in February 1988, the next decade averaged a 12% return per annum - you needed to remain invested to gain from this,’ Mr Rider says.4
Fast-forward 10 years and the Asian financial crisis also caused concerns that a collapse in the region would hit the global and Australian economies. Mr Rider had left the Reserve Bank and was now Chief economist in Australia for investment bank UBS.
Mr Rider says the US Federal Reserve eased rates in response to these concerns while the RBA kept rates lower than would have otherwise been the case.
Economic growth and earnings remained strong and provided the backdrop for the ‘dot-com’ bubble of 1999.
Australia sidesteps dot.com bust
The bubble inevitably burst, with the US market crashing down but the Australian market held up relatively well.
‘The US equity market took two years to go from peak to trough,’ Mr Rider says. ‘But the Australian share market held up relatively well due to its lack of technology exposure’.
In this instance it took six years for the US to return to its 2000 peak, but Australia surged on the back of the China commodity price boom and highlights the benefits a diversified source of returns and remaining invested.
By 2007, Mr Rider was in the asset management division of UBS, studying the Chinese economy and forecasting commodity prices when the Global Financial Crisis struck.
‘Between 2003 and 2007, real Chinese GDP grew at 12% with steel production almost double this,’ he says.5
‘In the first half of 2008, commodity markets were very tight with many prices at historically high levels. I felt that you didn’t need much of a slowdown to get commodity prices falling sharply.’
The financial contagion that led to the GFC was unleashed by a banking crisis brought on by a collapse in the US real estate market.
The crisis forced some US banks to seek aid from the US federal government and sparked the collapse of Lehmann Brothers.
It also sparked the collapse in commodity prices Mr Rider had feared.
Mr Rider remembers landing in Chicago in October 2008 for a meeting and being told that the oil price had dropped below US$70 a barrel after peaking two months earlier at US$145 a barrel.
Calm after GFC storm
Calm was ultimately restored by a range of measures to stabilise the financial system, such as the guarantee of bank deposits and capital injections to banks. However, it took until February 2009 for a bottom to be reached.
The depth of the downturn this time meant it took 5 to 6 years for both the US and Australian share markets to regain their previous peak. Median superannuation returns fell for two years before commencing an uninterrupted 10 year run of strong returns.6
Fast forward to early 2022 and Mr Rider said he watched the huge government stimulus being poured into COVID-19 financial measures and zero interest rates with some concern.
‘Governments provided all this stimulus in the first couple of years of the crisis and by 2022 we were coming out of lockdown. Rapid growth in demand was met by supply issues and inflation quickly followed,’ Mr Rider says.
Mr Rider had just joined Brighter Super at the time, and he said the risk of inflation was one of the first issues he investigated.
He said a book by the Organisation for Economic Co-operation and Development (OECD) on lessons learned from the 1970s, given to him by former RBA Governor Ian Macfarlane, linked expansionary fiscal policy (i.e. government budget deficits) with the rise in inflation.
While globalisation had weakened the link between domestic fiscal policy and inflation because it facilitated access to cheap imports, the failure in global supply chains because of COVID-19 and geo-political tensions, combined with the economy’s return to full employment, reinstated the link’s potency.
Mr Rider says one of the lessons of past crises is that central bank and government responses often lay the foundations for the next crisis.
In most cases governments have unleashed too much spending and central banks have kept interest rates too low for too long – sparking a boom or most recently an inflation outbreak.
In the most recent economic shock, Mr Rider said the RBA erred by keeping rates too low for too long as high inflation emerged.
However, he says the RBA and other central banks around the world then responded with the most rapid tightening in rates on record.
‘The Australian economy has slowed but is still growing,’ Mr Rider says.
‘The US Federal Reserve is on the cusp of easing as US inflation has fallen. This big shock on inflation is increasingly a thing of the past.’
Despite the rapid rise of inflation and interest rates, both the Australian and US markets have moved to new highs, bolstering superannuation returns.
Lessons on riding out ups and downs
Reflecting on this working lifetime punctuated by market crisis, Mr Rider says ‘volatility in your super returns is a fact of life but members need to keep in mind that the swings in the market can be both up and down. Over the longer run the trend is for positive returns and so I believe it’s best to remain invested through these periods of volatility’.
‘When we build our investment options, we diversify across asset classes to help them navigate the wild swings we inevitably will see. All of these periods of crisis are different in some way, but the one common outcome is that investors who have held the course and remained invested have been able to experience both sides of market volatility, building their retirement nest egg through strong, long run returns.’
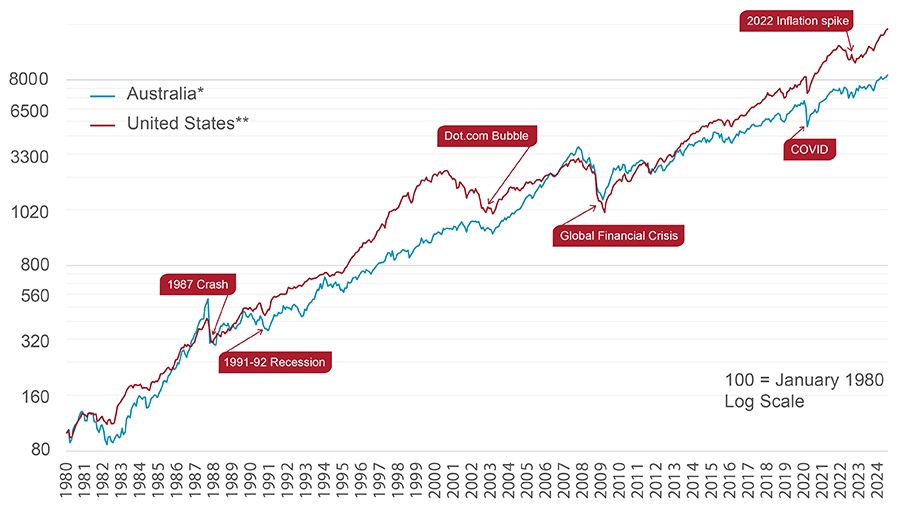
Long run share market total return (includes dividends)

* The S&P ASX All Ordinaries is a product of S&P Dow Jones Indices LLC or its affiliates (“SPDJI”) and ASX Operations Pty Limited, and has been licensed for use by Brighter Super Trustee. S&P®, S&P 500®, US 500, The 500, iBoxx®, iTraxx® and CDX® are trademarks of S&P Global, Inc. or its affiliates (“S&P”); Dow Jones® is a registered trademark of Dow Jones Trademark Holdings LLC (“Dow Jones”); ASX Operations Pty Limited Trademarks are trademarks of the ASX Operations Pty Limited and these trademarks have been licensed for use by SPDJI and sublicensed for certain purposes by Brighter Super Trustee.Brighter Super Trustee investment options are not sponsored, endorsed, sold or promoted by SPDJI, Dow Jones, S&P, their respective affiliates, or ASX Operations Pty Limited and none of such parties make any representation regarding the advisability of investing in such product(s) nor do they have any liability for any errors, omissions, or interruptions of the S&P ASX All Ordinaries.
** United States stock market total return data based upon Robert Shiller’s analysis https://shillerdata.com


